Graph of active users for a single page

GA4 is here and we better get used to it. One thing I sorely miss is the ability to see a nice graph displaying the traffic to a single page. In the good old days all I had to do was click the page title in GA and then I could look at visitors over time. Not any more.
So I decided to see if I could solve this using Google Data Studio (which I’ll refer to as GDS from now on). I could and it was pretty straight forward.
A guide for those that are completely new to Data Studio.
Here’s how you do it.
- In GDS you click on Add Chart then Time series chart
- Make sure the Dimension is Date and set the Metric to Active Users
Now you have a nice graph of all traffic to your domain, that’s not what we’re after though so let’s keep chipping away at this
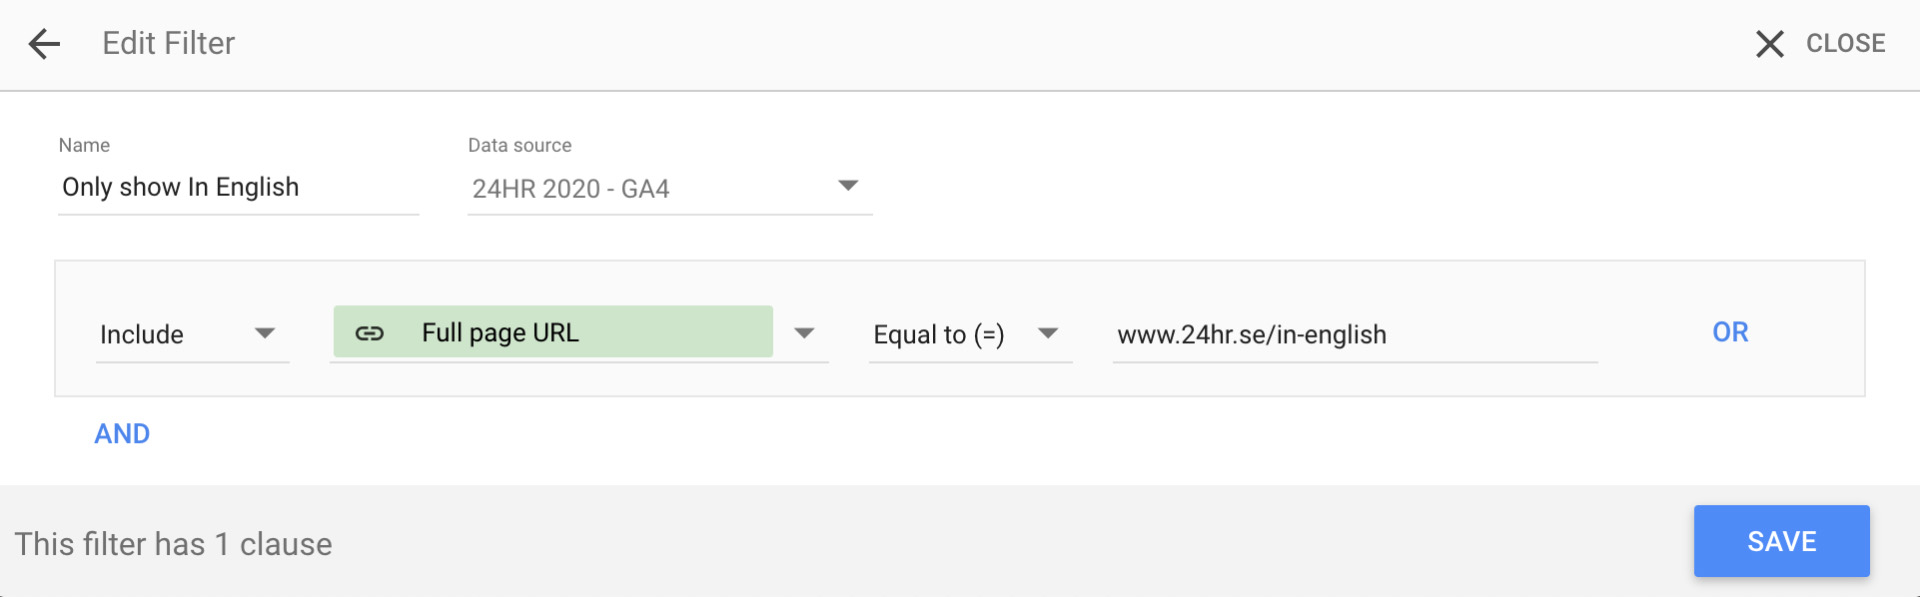
In order to show traffic to a single page you set up a filter. Go to Resources -> Manage Filters and click Add a filter at the bottom.
As with everything Google there are a myriad of ways of doing this. Here’s one that I find pretty straightforward:
- Leave the first drop down as it is, i.e. Include
- In the second one, search for Full page URL and select it
- Set Condition to Equal to (=)
- Copy and paste the URL for the page you want to see stats for, but leave out any https:// bit and let the URL begin with www
- NAME YOUR FILTER, you will thank yourself in the future
Click SAVE

Right, time to go back to the page with your graph and select it. Look to the right where all the setting are and scroll down in the left column until you see the ADD FILTER button
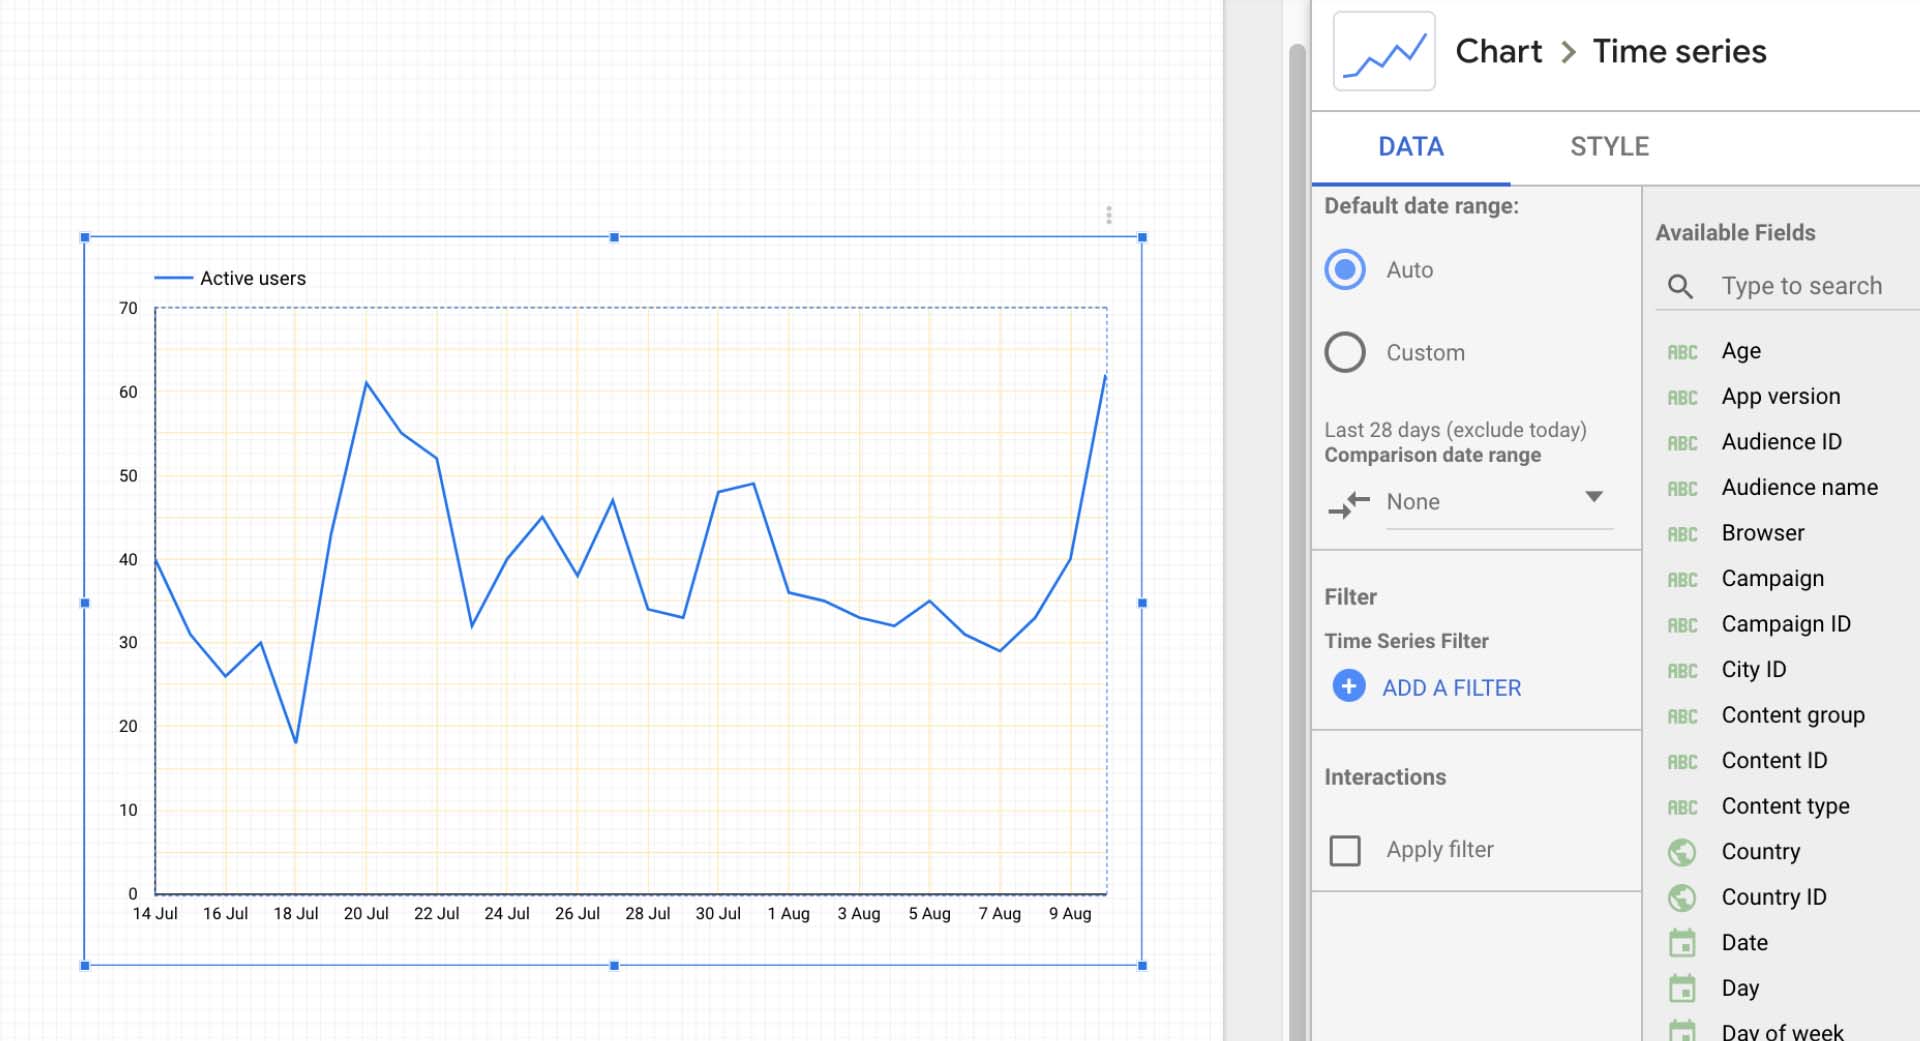

Yep, you guessed it. Click that button (that doesn’t look much like a button) and select your well named filter.
The graph should change in real time. If you have no data that could be because you left the https:// bit at the beginning of the URL in the filter. Go back and correct that.
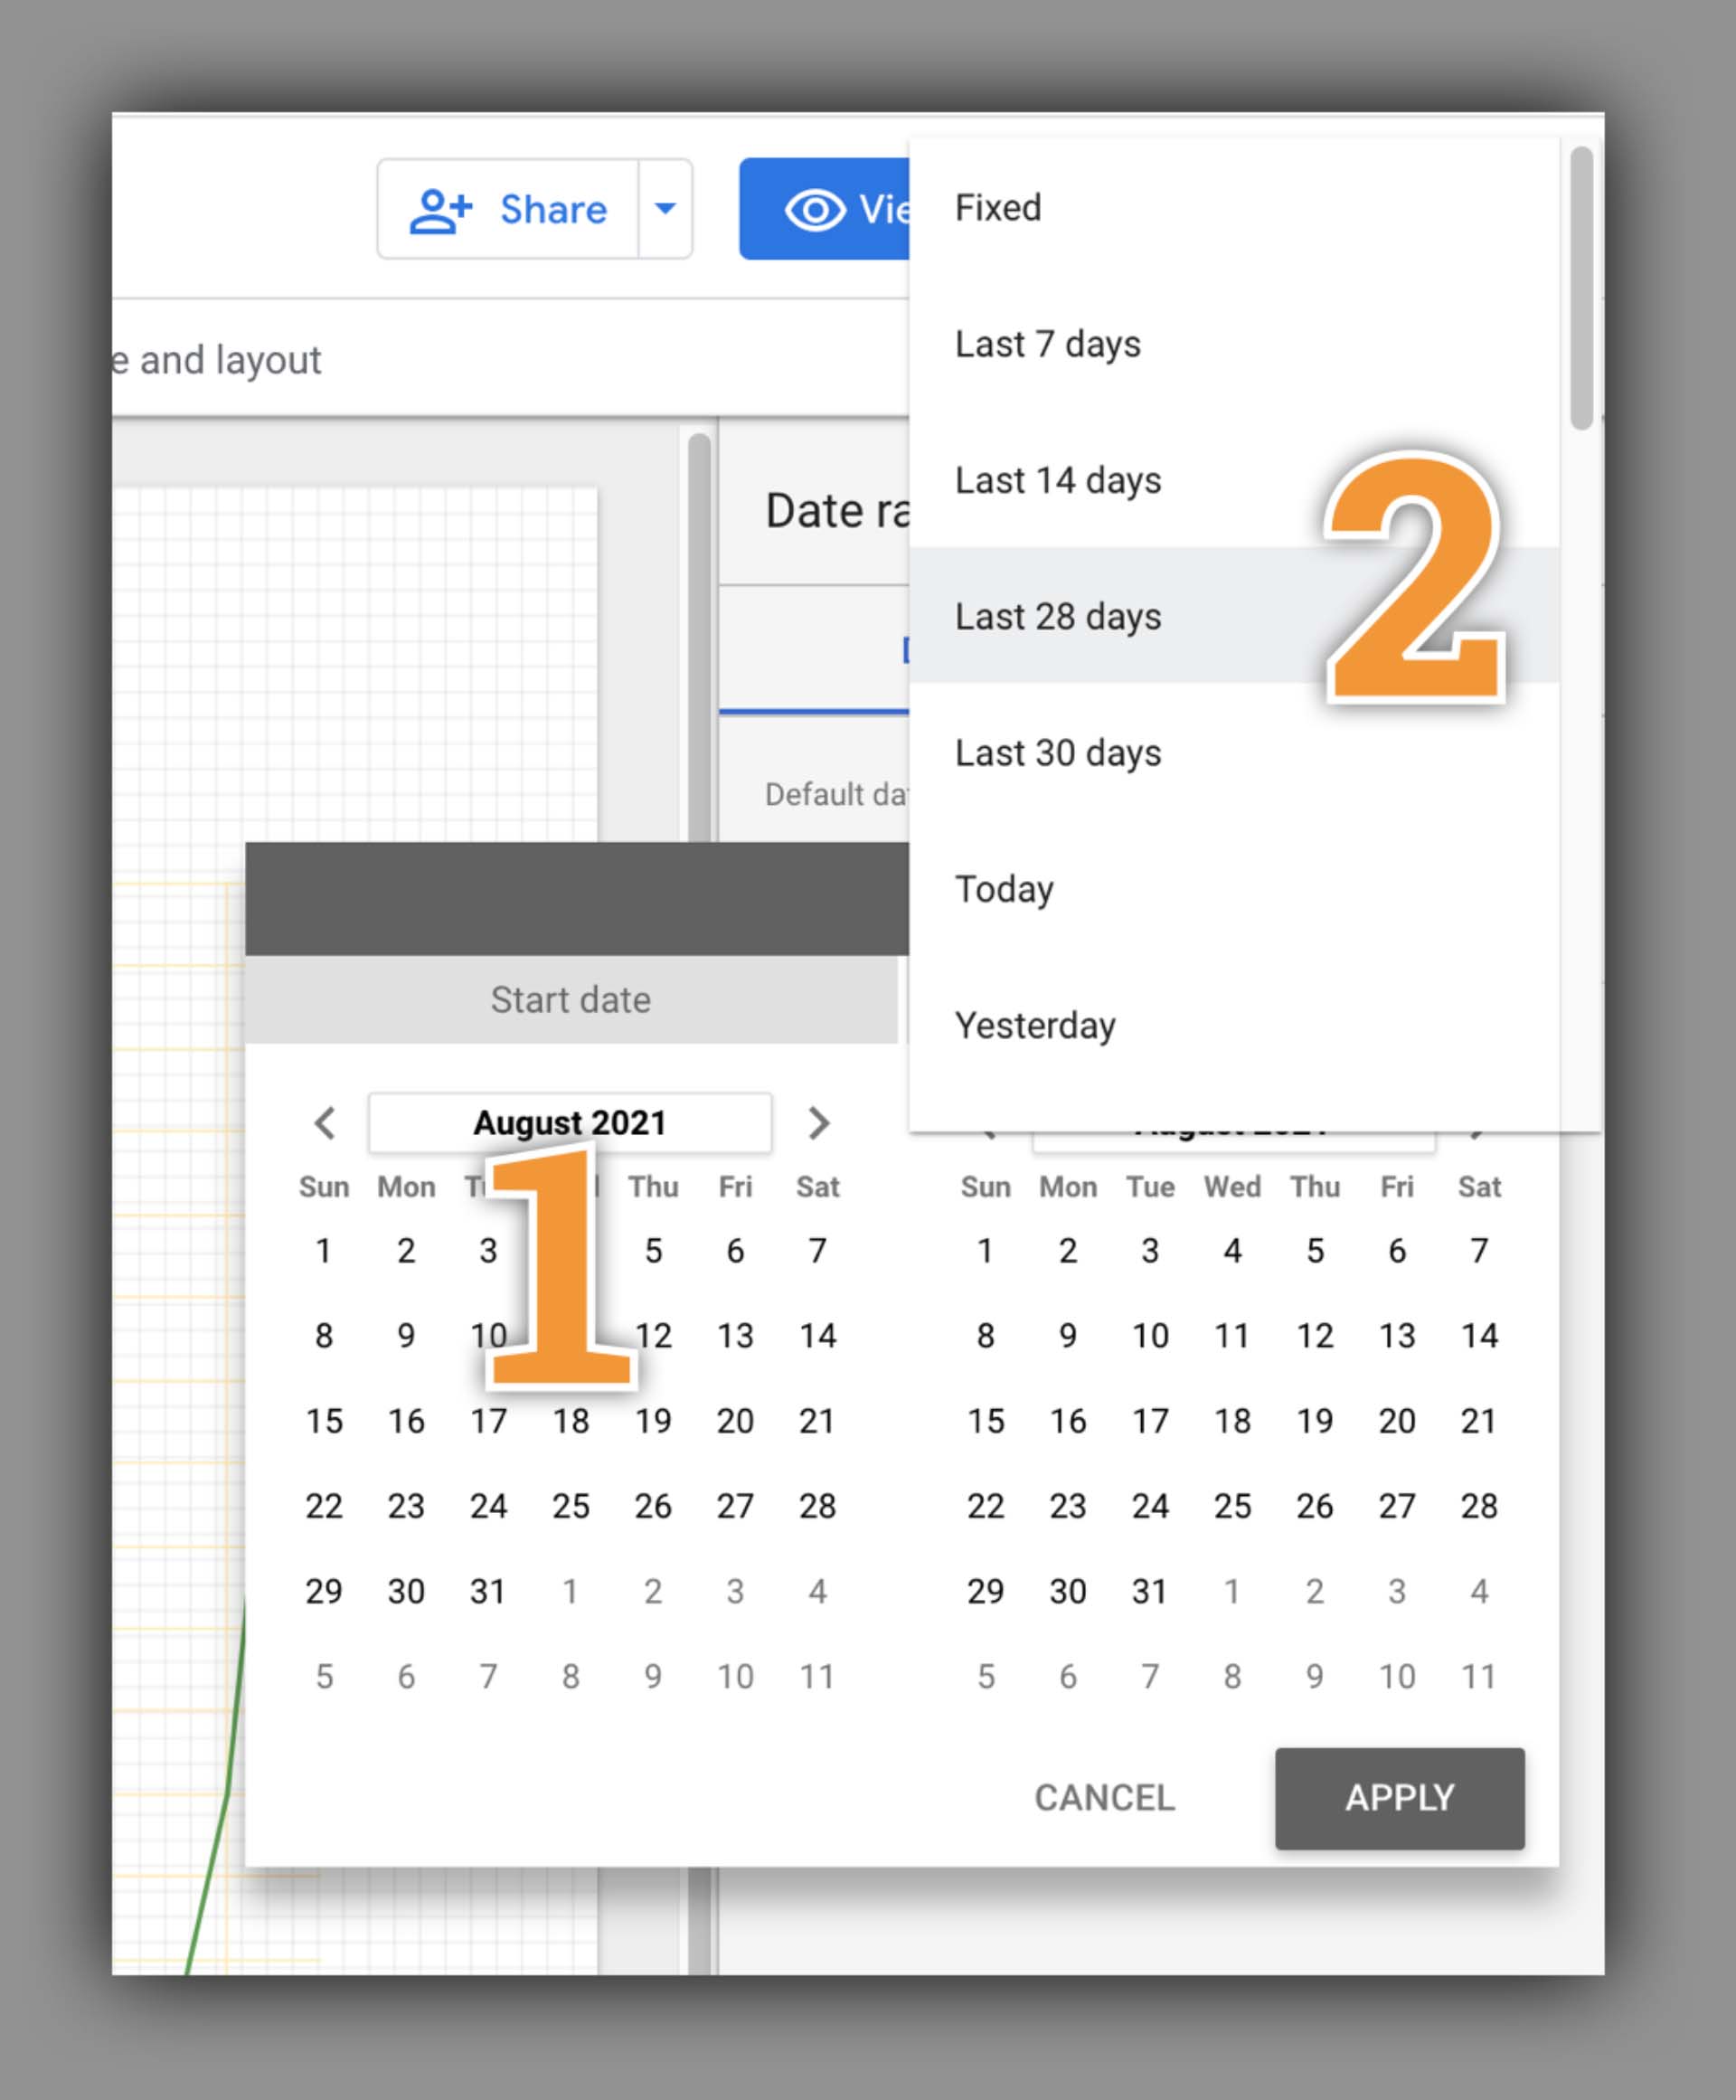

As a final flourish I like to click Add control -> Date range control and then set the Auto date range to Last 28 days. This control will allow you to change the date range for the graph when you view it.
Well done! Google Data Studio can be used for a lot of things, and to make it even more fun you can add other data sources. Like YouTube. So if I ever decide to make a video tutorial for this page, I’ll be able to have a GDS page where I see visitors to this tutorial compared to YouTube views and number of comments etc.
If that’s something you think sounds interesting, please head over to this video and leave a comment.